Water Quality Batch Run
The Water Quality Batch Run feature allows you to perform a combined Water Quality Trace or Constituent analysis. You can then use the provided reporting tools to graph the combined effects of each type of analysis on various parts of your system, or to review system-wide tabular statistics reports.
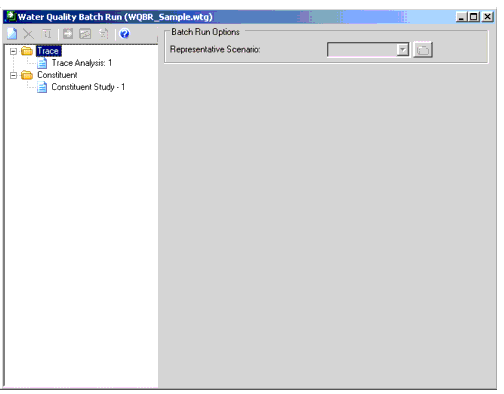
The dialog consists of a list pane on the left that displays all of the trace and constituent batch analyses in the hydraulic model along with the following controls:
- New: Creates a new Trace or Constituent analysis. Highlight the folder for the type of analysis you want to create and click New.
- Delete: Deletes the trace or constituent analysis that is currently highlighted in the list pane.
- Rename: Allows you to enter a new label for the trace or constituent analysis that is currently highlighted in the list pane.
- Compute: Calculates the trace or constituent analysis that is currently highlighted in the list pane.
- Graph: After an analysis has been computed, this button opens the Graph Element Selection dialog, allowing you to select the elements to graph.
- Statistics Table: Opens the Water Quality Batch Run Statistics Table dialog, which displays statistics for each node and pipe.
- Help: Opens the online help.
The controls available in the right side of the dialog change depending on whether a Trace or Constituent analysis is highlighted in the list pane.
Trace Analysis
When a Trace analysis is highlighted in the list pane the right side of the dialog will look like this:
The following controls are available:
- Representative Scenario: Choose the scenario that represents the state of the system you would like to analyze. Select the scenario from the list or click the Scenarios button to open the Scenarios dialog and select the desired scenario from the tree view.
- Select Elements: Click this button to return to the drawing pane to select the trace source elements that will be used for the analysis.
- Source Element Table: This table lists the selected trace source elements that will be used in the analysis. The element Label, Element ID, and Element Type are displayed for each trace source element.
Constituent Analysis
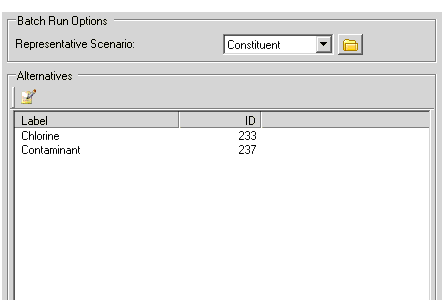
When a Constituent analysis is highlighted in the list pane the right side of the dialog will look like this:
The following controls are available:
- Representative Scenario: Choose the scenario that represents the state of the system you would like to analyze. Select the scenario from the list or click the Scenarios button to open the Scenarios dialog and select the desired scenario from the tree view.
- Select Alternatives to Analyze: Opens the Select Alternatives to Analyze dialog, allowing you to choose which alternatives will be used in the Constituent analysis.
- Alternatives Pane: This area displays the alternatives to be analyzed.


